
Refining the Isolation Metric
Nabla containers are designed around the idea that thinner, lower-level interfaces between the guest containers and the (shared and privileged) host kernel result in better isolation for tenants in the cloud. The reasoning is, when comparing to fatter, more high-level interfaces: (1) thinner interfaces are assumed to be more easily guarded, and (2) the need to only implement lower-level abstractions leads to less complexity in the underlying layer, which, in turn, leads to a lower probability of bugs that can ultimately result in the compromise of the isolation implemented by the underlying layer. These arguments are not new: we are all familiar with similar arguments involving hypervisors and VM isolation.1
Unfortunately, terms like “thin interface” or “low-level interface” are somewhat subjective. We have been working on various ways to quantify it in different scenarios, which we refer to as our “isolation metric”.
Counting kernel code
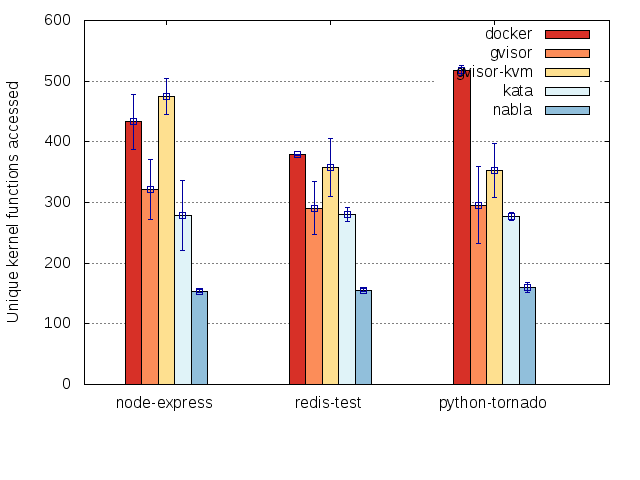
Our first stab at an isolation metric is based on counting the amount kernel code needed to support various containers. We make the assumption that the less kernel code we observe is a proxy for less complexity, which is a proxy for less bugs/vulnerabilities, which is a proxy for greater assurance that the underlying kernel code is maintaining isolation.
We use the kernel’s ftrace mechanism to trace container-related
pids while containers are running. For ease of measurement, we do
not measure the startup coverage of the containers. We also process
the raw traces primarily to eliminate interrupts, which may perform
work on behalf of other processes. Then, we compile a list of the
unique kernel functions that have been exercised. Here is an example
of how much nabla containers improve isolation over other mechanisms
based on this metric:
Factoring in code complexity
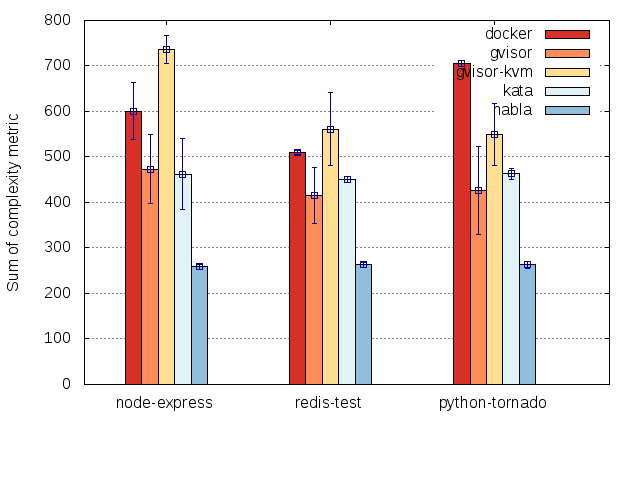
However, an increased number functions in the kernel does not always
imply more complexity because some functions are more complex than
others. As a next step, we used the GNU complexity tool to
calculate a score for every function in the kernel, then weighted each
function by that score. This seems reasonable, as our assumption has
been about relating number of kernel functions to complexity.
Somewhat surprisingly, we observe the same basic pattern with this
weighting, which might indicate that simply counting kernel functions
is not such a bad proxy for complexity:
Limitations and other ideas
There are two major limitations in this metric. First, the sample applications are not a representative set in that they do not try to maximize the coverage in the kernel. In other words, different applications may require different features of the kernel, meaning that we are underestimating the true complexity metric for how complex the kernel needs to be. Second, counting kernel functions does not account for guarding, namespacing, or any other mechanism that trades code complexity for enhanced protection in the data (rather than code) dimension. We are thinking of ways to incorporate the data dimension in future measurements.
Please see our measurement repository, run the experiments for yourself, and feel free to raise any issues/discussion points you may have there!
-
For more information about this way of thinking about container isolation, check out our HotCloud ‘18 paper Say Goodbye to Virtualization for a Safer Cloud or James’ blog post about the Horizontal Attack Profile in the cloud. ↩